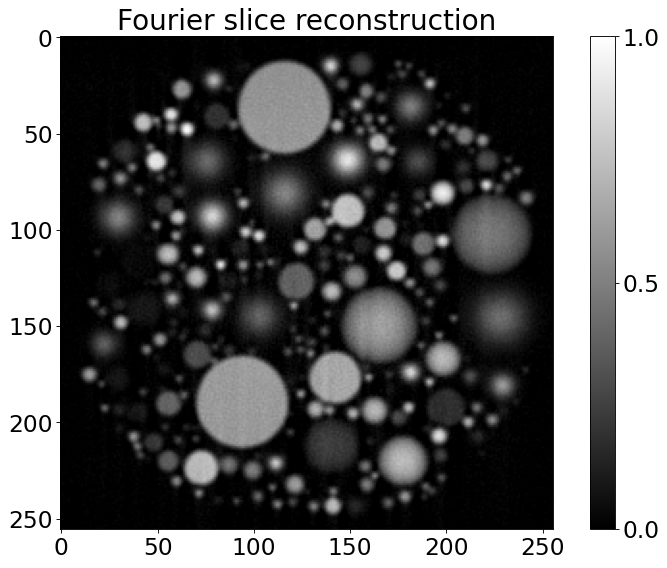
Stochastic phantom 2D and reconstruction#
Using TomoPhantom to:#
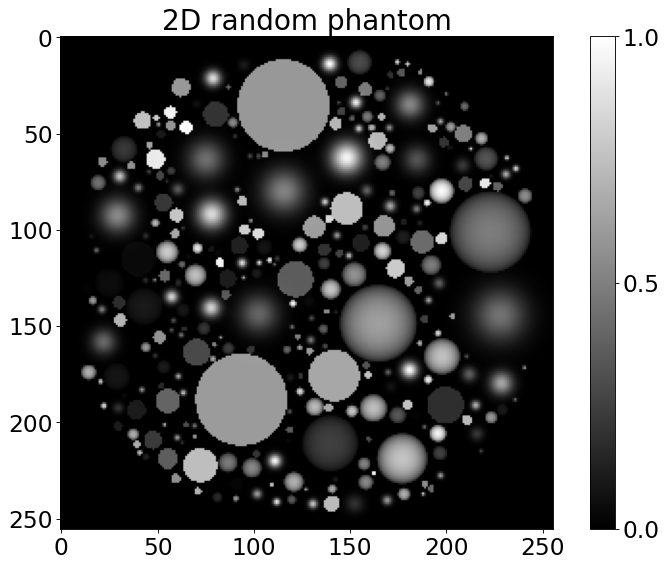
build a phantom with randomised parameter values, using
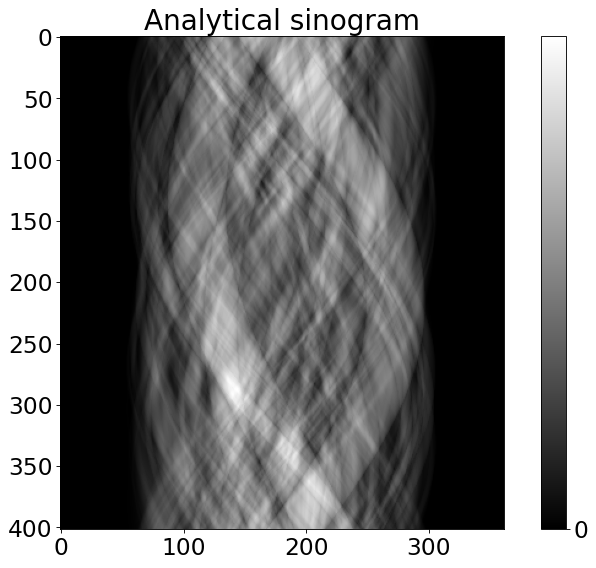
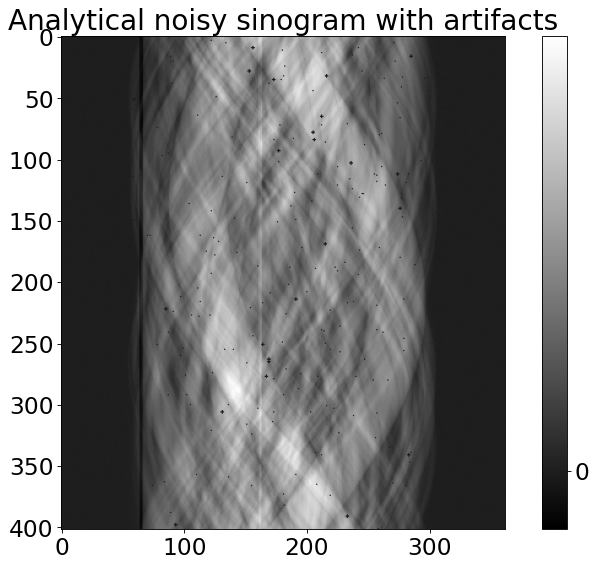
foamfunctiongenerate analytical sinogram from it and add various artifacts to it
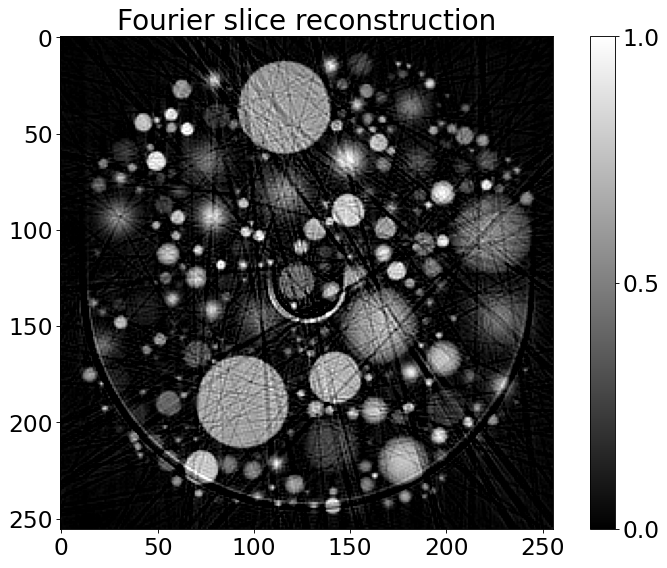
reconstruct the noisy sinogram using the Fourier method (ToMoBAR package required)
[1]:
import numpy as np
import matplotlib.pyplot as plt

from tomophantom import TomoP2D
from tomophantom.generator import foam2D

plt.rcParams['figure.figsize'] = [12, 8]
plt.rcParams['figure.dpi'] = 80
[2]:
# generate a random phantom
N_size = 256 # define the grid size
tot_objects = 300 # the total number of objects to generate

# define ranges for parameters
x0min = -0.9
x0max = 0.9
y0min = -0.9
y0max = 0.9
z0min = -0.9
z0max = 0.9
c0min = 0.01
c0max = 1.0
ab_min = 0.01
ab_max = 0.25

(Objfoam2D, myObjects) = foam2D(x0min, x0max, y0min, y0max, \
                               c0min, c0max, ab_min, ab_max, \
                               N_size, tot_objects, \
                               object_type = 'mix')

plt.figure(1)
plt.rcParams.update({'font.size': 21})
plt.imshow(Objfoam2D, vmin=0, vmax=1, cmap="gray")
plt.colorbar(ticks=[0, 0.5, 1], orientation='vertical')
plt.title('2D random phantom')
[2]:
Text(0.5, 1.0, '2D random phantom')
[3]:
# generate analytical sinogram
angles_num = int(0.5*np.pi*N_size); # angles number
angles = np.linspace(0,180,angles_num,dtype='float32')
angles_rad = angles*(np.pi/180)
P = int(np.sqrt(2)*N_size) #detectors

sino_Objfoam2D = TomoP2D.ObjectSino(N_size, P, angles, myObjects)

plt.figure(2)
plt.rcParams.update({'font.size': 21})
plt.imshow(sino_Objfoam2D,  cmap="gray")
plt.colorbar(ticks=[0, 150, 250], orientation='vertical')
plt.title('Analytical sinogram')
[3]:
Text(0.5, 1.0, 'Analytical sinogram')
[5]:
from tomophantom.artefacts import artefacts_mix

#adding noise
_noise_ =  {'noise_type' : 'Poisson',
            'noise_sigma' : 5000, # noise amplitude
            'noise_seed' : 0}

# adding zingers and stripes
_zingers_ = {'zingers_percentage' : 0.2,
             'zingers_modulus' : 10}

_stripes_ = {'stripes_percentage' : 0.8,
             'stripes_maxthickness' : 2,
             'stripes_intensity' : 0.25,
             'stripes_type' : 'full',
             'stripes_variability' : 0.002}

noisy_sino = artefacts_mix(sino_Objfoam2D, **_noise_, **_zingers_, \
                         **_stripes_)

plt.figure()
plt.rcParams.update({'font.size': 21})
plt.imshow(noisy_sino,cmap="gray")
plt.colorbar(ticks=[0, 150, 250], orientation='vertical')
plt.title('Analytical noisy sinogram with artifacts')
Zingers have been added to the data.
Stripes leading to ring artefacts have been simulated.
Poisson noise has been added to the data.
[5]:
Text(0.5, 1.0, 'Analytical noisy sinogram with artifacts')
[6]:
# one can use a ToMoBAR package to reconstruct the data
# install it with: conda install -c dkazanc tomobar

# initialise tomobar DIRECT reconstruction class ONCE
from tomobar.methodsDIR import RecToolsDIR
RectoolsDIR = RecToolsDIR(DetectorsDimH = P,  # DetectorsDimH # detector dimension (horizontal)
                          DetectorsDimH_pad=0, # Padding size of horizontal detector
                          DetectorsDimV = None,  # DetectorsDimV # detector dimension (vertical)
                          CenterRotOffset = None, # Centre of Rotation (CoR) scalar
                          AnglesVec = angles_rad, # array of angles in radians
                          ObjSize = N_size, # a scalar to define reconstructed object dimensions
                          device_projector='cpu')
print ("%%%%%%%%%%%%%%%%%%%%%%%%%%%%%%%%%%%%%%%%%%%%%%%%%%%%%%%%%%%%")
print ("Reconstructing analytical sinogram using Fourier Slice method")
print ("%%%%%%%%%%%%%%%%%%%%%%%%%%%%%%%%%%%%%%%%%%%%%%%%%%%%%%%%%%%%")
RecFourier = RectoolsDIR.FOURIER(noisy_sino, method='linear')
plt.figure()
plt.imshow(RecFourier, vmin=0, vmax=1, cmap="gray")
plt.colorbar(ticks=[0, 0.5, 1], orientation='vertical')
plt.title('Fourier slice reconstruction')
%%%%%%%%%%%%%%%%%%%%%%%%%%%%%%%%%%%%%%%%%%%%%%%%%%%%%%%%%%%%
Reconstructing analytical sinogram using Fourier Slice method
%%%%%%%%%%%%%%%%%%%%%%%%%%%%%%%%%%%%%%%%%%%%%%%%%%%%%%%%%%%%
[6]:
Text(0.5, 1.0, 'Fourier slice reconstruction')
[14]:
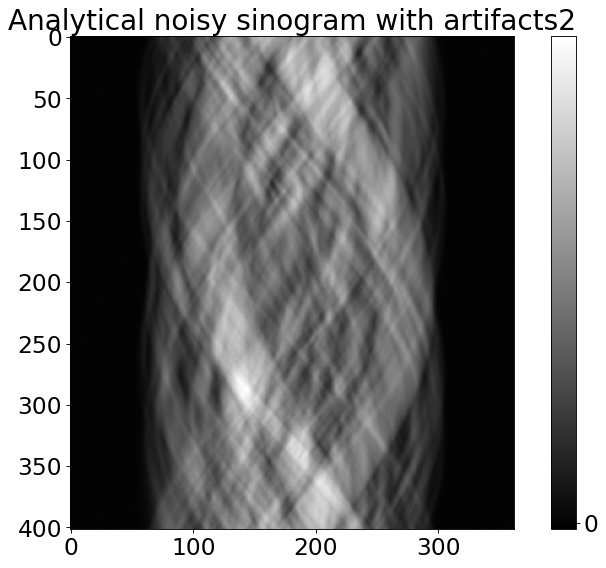
# partial volume effect and fresnel diffraction artifacts
_pve_ = {'pve_strength' : 1}
_fresnel_propagator_ = {'fresnel_dist_observation' : 10,
                        'fresnel_scale_factor' : 10,
                        'fresnel_wavelenght' : 0.003}
#adding noise
_noise_ =  {'noise_type' : 'Poisson',
            'noise_sigma' : 15000, # noise amplitude
            'noise_seed' : 0}

noisy_sino_fresnel = artefacts_mix(sino_Objfoam2D, **_noise_, \
                             **_pve_,\
                            **_fresnel_propagator_)
plt.figure()
plt.rcParams.update({'font.size': 21})
plt.imshow(noisy_sino_fresnel,cmap="gray")
plt.colorbar(ticks=[0, 150, 250], orientation='vertical')
plt.title('Analytical noisy sinogram with artifacts2')
Partial volume effect (PVE) has been simulated.
Fresnel propagator has been simulated.
Poisson noise has been added to the data.
[14]:
Text(0.5, 1.0, 'Analytical noisy sinogram with artifacts2')
[ ]:
# one can use a ToMoBAR package to reconstruct the data
# install it with: conda install -c dkazanc tomobar

# initialise tomobar DIRECT reconstruction class ONCE
from tomobar.methodsDIR import RecToolsDIR
RectoolsDIR = RecToolsDIR(DetectorsDimH = P,  # DetectorsDimH # detector dimension (horizontal)
                          DetectorsDimH_pad=0, # Padding size of horizontal detector
                          DetectorsDimV = None,  # DetectorsDimV # detector dimension (vertical)
                          CenterRotOffset = None, # Centre of Rotation (CoR) scalar
                          AnglesVec = angles_rad, # array of angles in radians
                          ObjSize = N_size, # a scalar to define reconstructed object dimensions
                          device_projector='cpu')
print ("%%%%%%%%%%%%%%%%%%%%%%%%%%%%%%%%%%%%%%%%%%%%%%%%%%%%%%%%%%%%")
print ("Reconstructing analytical sinogram2 using Fourier method")
print ("%%%%%%%%%%%%%%%%%%%%%%%%%%%%%%%%%%%%%%%%%%%%%%%%%%%%%%%%%%%%")
RecFourier2 = RectoolsDIR.FOURIER(noisy_sino_fresnel, method = 'linear')
plt.figure()
plt.imshow(RecFourier2, vmin=0, vmax=1, cmap="gray")
plt.colorbar(ticks=[0, 0.5, 1], orientation='vertical')
plt.title('Fourier slice reconstruction')
%%%%%%%%%%%%%%%%%%%%%%%%%%%%%%%%%%%%%%%%%%%%%%%%%%%%%%%%%%%%
Reconstructing analytical sinogram2 using Fourier method
%%%%%%%%%%%%%%%%%%%%%%%%%%%%%%%%%%%%%%%%%%%%%%%%%%%%%%%%%%%%
Text(0.5, 1.0, 'Fourier slice reconstruction')
